
Article co-written by, Yi-Chiuan Lai, Industrial Engineer.
Breweries faced unimagined challenges throughout 2020-2021. Brewers ponder solutions not only for practical reasons but mere survival. We have officially entered a new era; the Brave New World has arrived. I’ll offer two considerations.
First, there must be quality interplay between brewers, their distributors and their retailers. Second and most critical, brewers must look inward, take control of their brewhouse and balance the line within their current mode of production.
These two approaches, attacked in tandem, will yield results and bring the brewer to a new level in market presence, capability, and production control processes.
Communicate Well With Your Distributors and Retail Outlets
This is an understatement.
Relationship management should be more of a measured traditional approach.
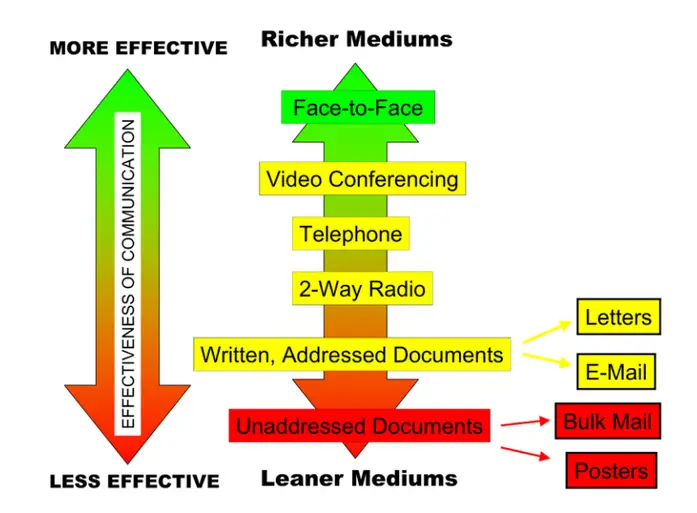
It must emphasize Channel Richness. This includes face-to-face and phone calls at the least.
There was a time when emails, texts, and quick chats when dropping by or having a pint was enough. This is not enough any longer.
Exhibit discipline and rigor in maintaining your existing relationships. Take the opportunities given to thoroughly communicate your message, service, and products. This is not to say you will camp out on their doorsteps or harass them incessantly for Online meetings. This is to say that a methodical approach is needed, where casual had previously sufficed.
The channel, or medium, used to communicate a message affects how accurately the message is received. Verbal, written, and nonverbal communications have different strengths and weaknesses. In addition, a smart manager is aware of the nonverbal messages conveyed by either type of communication—as noted earlier, only 7% of verbal communication comes from the words themselves. (principlesmanagement/chapter/12-6)
Depending on the month and geographical location there are times and spaces to have some conversations with your main distributors and main retail vendors. Some associates will put the numbers above all else. How many units, seats, cases, tables turn guide each and every decision.
Other vendors will consider the numbers and consider their identity and market segment. What role do they play, how it balances with their vision, and how it may be leveraged to make their position stronger? Your unique properly segmented artisanal beers may be a part of that.
Position yourself to be a fulcrum for their leveraging. Listen and listen well. The product should speak for itself and sell moderately well at the least, popular is good and top 5 is the target.
Make yourself indispensable. Give something extra. What that extra is depends on you. Making your message and your brand promise crystal clear is vital now more than ever. Check more about brand promise in the article, How Do We Make Our Beers Stand Out in a Crowded Market?
I would bring a keg or at least a pony to company parties. When I had a new product I would personally take it to an owner or manager to taste. Tell them the story. If they know it they can sell it.
Production Pacing and Balancing the Line
We’ll now turn to operations management principles applied to brewing. The goal is eliminating bottlenecks and saving wasted motion.
Waiting is part of life. However, if you have to wait, it means you are going to pay for the cost, as parts wait for their turn to be manufactured.
Why do parts need to wait for their turns for production? It’s simply because the machine can’t outpace the one before it in terms of processing time. That is, the output rate of the previous machine is greater than that of the current machine. This is called line imbalance. I strive to address this in layman’s terms, again in the article, 9 Ways To Raise Money and Cut Costs for Your Brewery NOW.
Line balancing is the key to reducing the production cost and increasing throughputs. However, it is not always easy and obvious to implement. The difficult part is all jobs are not naturally divided equally.
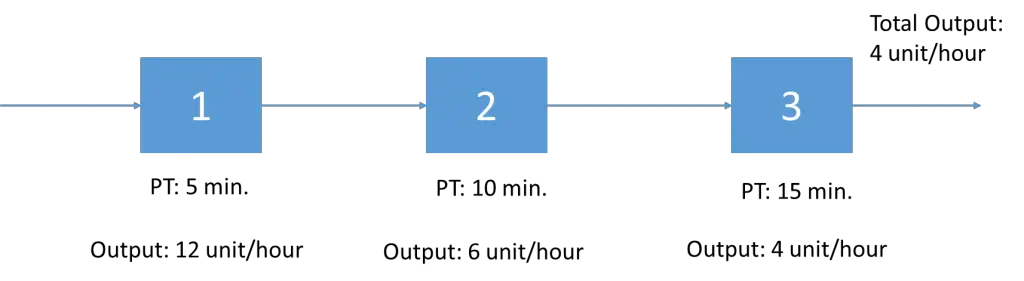
Let’s start at the beginning. We assume that we have a simple production system that includes three steps in sequence to produce a product. The processing times of the three steps are 5, 10, and 15 minutes, respectively. Figure 1 exhibits this simple production process.
As shown in the figure, the production rates of each step are 12, 6, and 4 units, respectively. The throughput for this production system is 4 units per hour. Imagine what would happen after an eight-hour shift? There will be 48 work-in-processes (WIPs) between steps 1 and 2, and 16 WIPs between steps 2 and 3. That is total of 64 WIPs are still waiting for their turns for production.
What went wrong? What if this goes on for weeks, months, or years? Those WIPs will just keep piling if workers at steps 1 and 2 keep working on his/her job. This is an imbalanced line. It is common for many production systems if they are not well designed in the beginning.
Is there any remedy or technique for imbalanced production lines? The answer is positively yes. Simply speaking, line balancing is every step achieving the same pace to complete its task.
Real-World examples
- filling kegs for delivery but they are still dirty
- fermentation is done but brite tanks are tied up
- must halt your brew day because the tank is still tied up
No need to tell you, everything is interrelated.
Let’s revisit the production system in Figure 1. How to balance it? Can we simply move things around in the system? We relocate 5-minute of work from step 2 to step 1, and 5-minute of work from step 3 to step 2. Then, we have a perfect balance.
That is, the processing time for each step is 10 minutes and there will not be any accumulations between steps. Unfortunately, things can rarely just be moved around like this. Nevertheless, we can combine steps 1 and 2 and make it become a two-step job. Then, we will have another perfect system and each step takes 15 minutes. Even though we have reduced one step for the system, the throughput is still the same. This doesn’t help much, as the throughput does not increase. It is still only 4 units per hour.
There is another way of thinking to balance this system. Ask the worker at step 1 only to work on their job for half hour and move to step 3 to help for the other half hour. This will decrease six outputs of step 1 and increase by two the output of step 3. Then, the throughput of the system will increase two units per hour. Then, we have balanced the system with six outputs per hour for every step.
Of course, if you have plenty of available capital, the easiest way to balance the line is to purchase equipment to balance the output of each step. However, the cost will dramatically increase. For many this is not an option.
How Do You Balance a Brewing Process?
The product, beers, are not discrete (separate and individual) units. They have to be processed in batches. In addition, the processing times of each step in the brewing process are greatly different, from minutes to days.
It’s not too difficult to balance it for large brewers. They can always increase capacities for those steps in short processing time by installing more equipment. However, it won’t be easy for a nano/ small commercial brewery.
How to overcome the huge differences between processes? There are some ways to balance the line. It’s totally up to the brewer’s objectives. Let’s assume that the brewer wants to be as efficient as possible. That is, minimizing the total waiting time.
Dividing the Brewing Process
We delineate the brewing process into 5 stages: wort production, primary fermentation, secondary fermentation, and post-fermentation (clarification/ carbonation) and packaging.
The average process times of a batch for each stage are 8 hours, 3 days, 7 days, and 24 hours, 4 hours respectively. We also assume that a shift equals 8 hours. We will also assume a day holds 1.5 shifts, 12 hours with possibly overlapping workers.
Let us assume a 10 bbl. system, about 1000 bbls. a year, so 2 brews per week. This would take 2 brewers or at least a full-time brewer and a helper.
Table: Times and Number of Shifts for Each Stage
| Stage | Time (hours) | Shifts (required output) | Shift *real time only – hours | |||||||
| Wort Production | WP | 8 | 1 | 8 | ||||||
| Primary fermentation | PF | 72 | 3 | 4 | ||||||
| Secondary fermentation | SF | 168 | 7 | 4 | ||||||
| Post-fermentation | PoF | 24 | 1 | 4 | ||||||
| Packaging | Pa | 4 | .5 | 4 | ||||||
| Total | 12.5 | 24 hours | ||||||||
Balancing the Brew Schedule
Our goal is to equalize outputs of each stage. As you can see from Table 2, process 1 –brewing– takes the most time, therefore we need to balance the process based on this stage.
For example, if we want to have 10 beer barrels (bbls) per day, then stages 1-5 need to finish each stage in 4.8 hours(real time) or about .6 shifts. This will be our magic number to balance each stage.
Line balancing can truly save time. Times equal cost. Cost reduction is the holy grail of every industry. Are you ready to do it?
Following the diagram in the next section, each step is spelled out in process and time. We need to use the time taken up by the non-value added steps to decrease brew days and bring the line into balance. The brewmaster knows what these steps are, therefore, during brewday and at other points in the process, you chip away at steps 2, 3, 4, and 5.
Streamline the System and Quality Control
The purpose of streamlining is to make your system as efficient as possible. The common method in the operations management is to increase the percentage of value-added steps in the process.
Any process that doesn’t change the product in some way is a non value-added process- for example: transferring cracked malt to the Mash, necessary but non value.. Material handling, inspection, waiting in the queue, storing are considered non value-added processes.
Table: Process Chart for a Beer Brewing Process
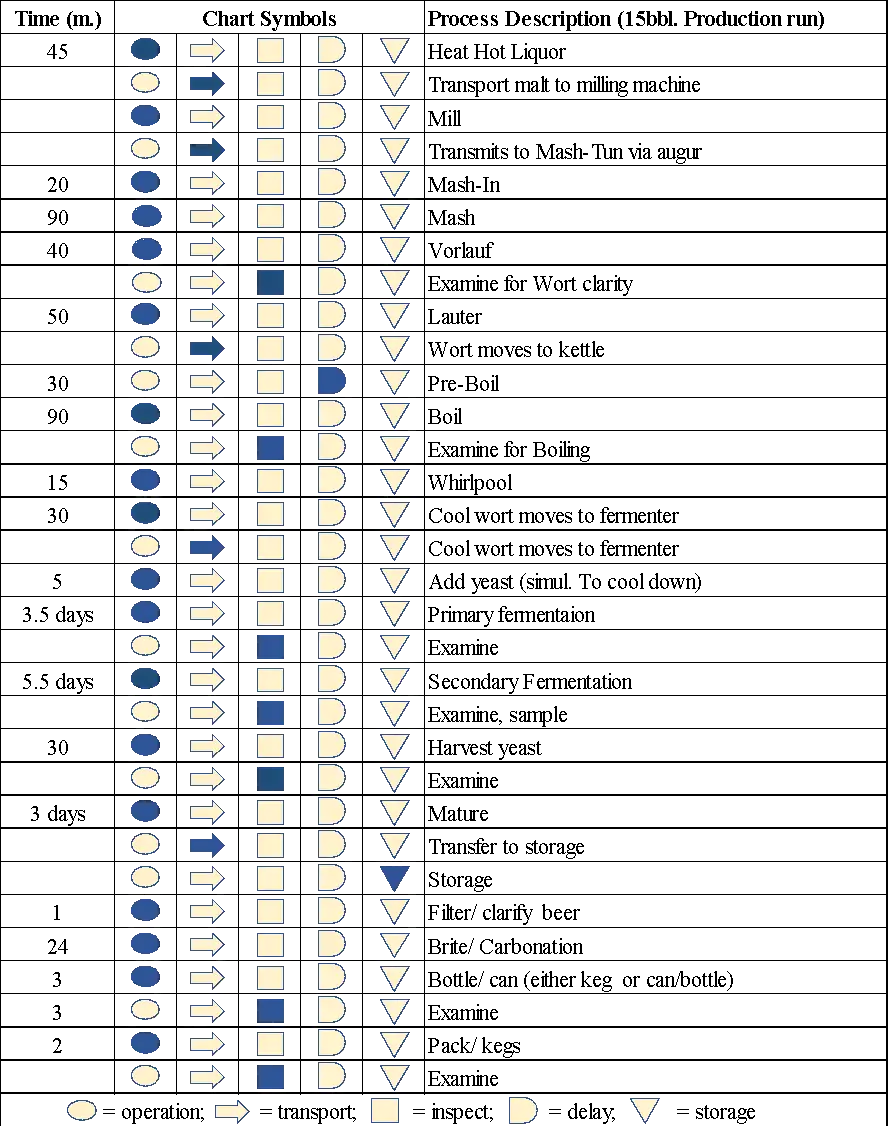
This table presents a beer brewing process. It’s not difficult to calculate the percentage of value-added steps in the process. Which steps are vital to the progression of production, and which are simply killing time? Which are adding value but passive, in that they do not require the brewers full attention?
The higher percentage of value-added means better streamlining. However, how to increase the percentage of value-added steps in the process is the puzzle. There are always techniques in the domain of Industrial Engineering available for you to choose.
Quality Control
To be a successful brewer, it is all about customer retention. Cheap products may attract customers, however, it’s the quality of the product that keeps them coming back.
There are three timings for quality checking, namely, before, during, and after production. We check the quality of material before brewing the beer, examine the quality of every step during the brewing process, and finally make sure the quality of the beer after the brewing process.
There are techniques for quality assurance, namely, acceptance sampling and statistical process control. Acceptance sampling is designed for checking the quality of the materials and final products, while statistical process control is made for control the quality during the production process.
Acceptance sampling is the technique of taking random samples from a batch (lot) of materials of finished products and measuring them in order to infer the quality of the entire batch. The result will be judged based on the acceptable quality level (AQL) and the lot tolerance percentage defective (LTPD) which were defined by the company’s quality policy to determine the fate of this batch of products, either to accept or to reject. Of course, there are certain risks involved in this technique. However, it is controllable. We can employ a MIL-STD-105D table to reduce the complexity of the technique.
Unlike acceptance sampling, what’s done is done, we could not do anything to remedy the situation (bad quality). All we can do is either return the entire batch or inspect the whole to eliminate all defects. On the contrary, statistical process control (SPC) techniques can save the day.
Statistical process control is the technique used when the process is still ongoing. The foundation of this technique is still random sampling. Unlike acceptance sampling, we don’t wait until the process finishes and sample from it. Instead, we take small samples periodically during the process. The results of the measurement will be put on a predefined (how? This will be another story.) control chart which can help us to determine if the current process is in control or out of control.

Tightening Up
There are many tools for quality management as mentioned above: acceptance sampling and statistical product control. Most of them are statistical methods. They are beyond the scope of this article at the moment but within reach of even the small brewer. As hyper-competition increases, even the artisan must look to technical processes to stay in the running. We can get into details later.
It is understood that some of the quality control functions above are highly technical in nature. Additionally, not taking these steps may restrict growth. Should you need to analyze your system and implement advanced quality control measures, we can help you do it. We have an engineer on the team.
[email-subscribers-form id=”2″]